

NEW - Visualize your data through highly configurable charts and tables.
Visualizer
- Visualize your data through highly configurable charts, tables, and more.
- Easily connect to a variety of data sources.
- Provides immediate high level information when and how you need it.
- Reduce the volume of data to review by using proprietary algorithm.
- Create custom reports that provide management with exactly what they need.
Visualizer
Easily Visualize Your Data
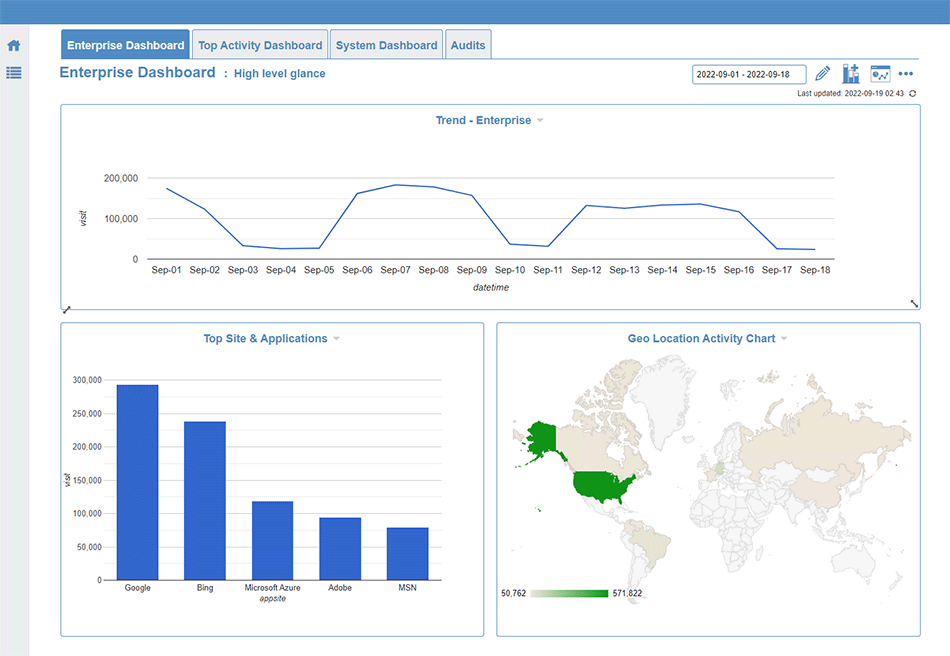
Dashboards
- Create, design, modify, view your own custom dashboards.
- Each dashboard can be comprised of multiple report panels.
- Create multiple custom dashboard "Tabs" each with a unique view and name.
- Resize panels to your desired height and width.
- Arrange panels by drag and drop, exactly where you want them.
Report Panels
- Easily connect to a variety of data sources.
- Select the type of chart, table, or map you want to add.
- Easily view and select your data source fields as dimensions & metrics.
- Preview panels in real time as you build and customize.
- Remove unwanted information by defining panel filters.
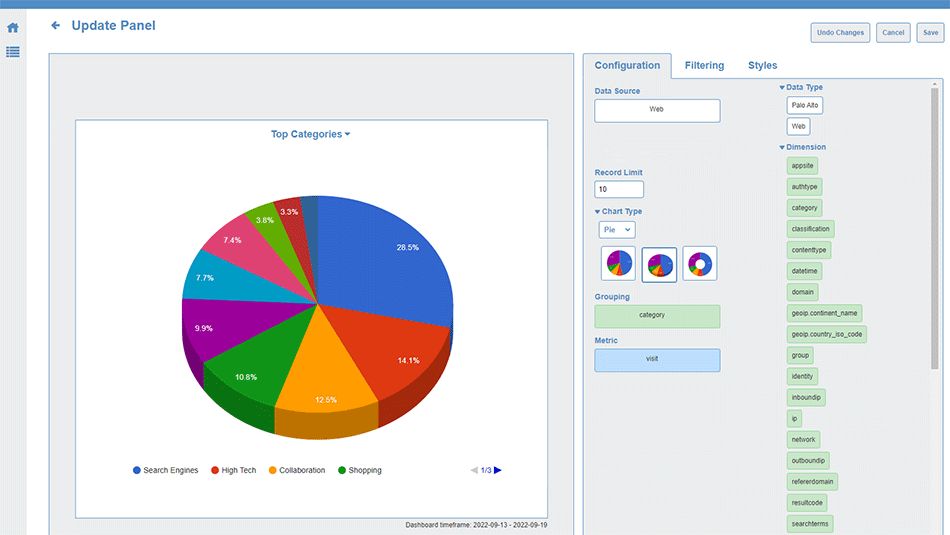
Report Panels
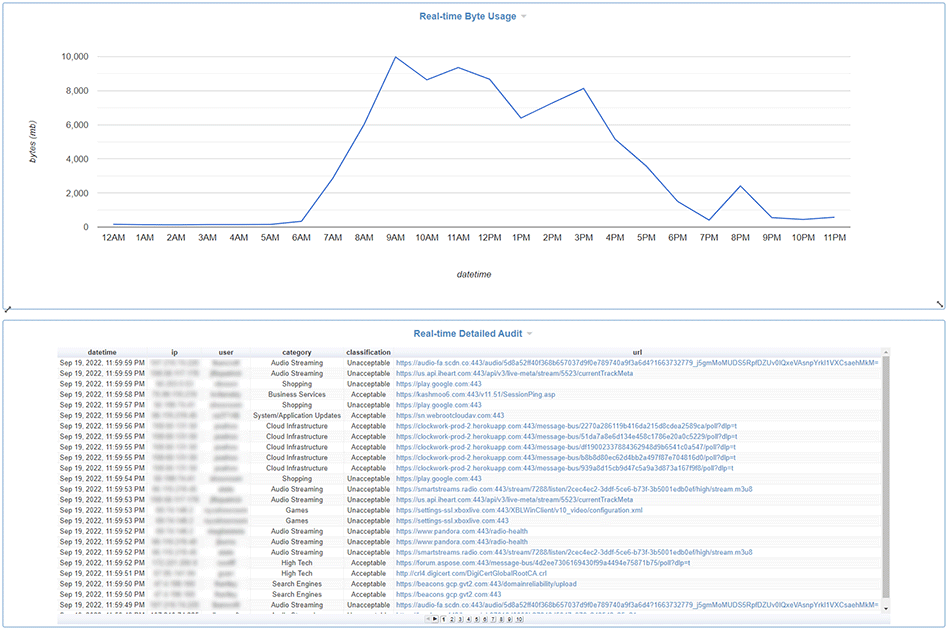
Real-time
Real-time Updates
- Real-time monitoring allows you to track performance over time.
- Identifies bandwidth hogs in real time and provides trending.
- Up-to-date knowledge on how your network is being used saves time and money.
- View information on-the-fly with a simple change of time frame or a click to refresh.
- Visibility right when you need it, in an easy-to-decipher chart or table.
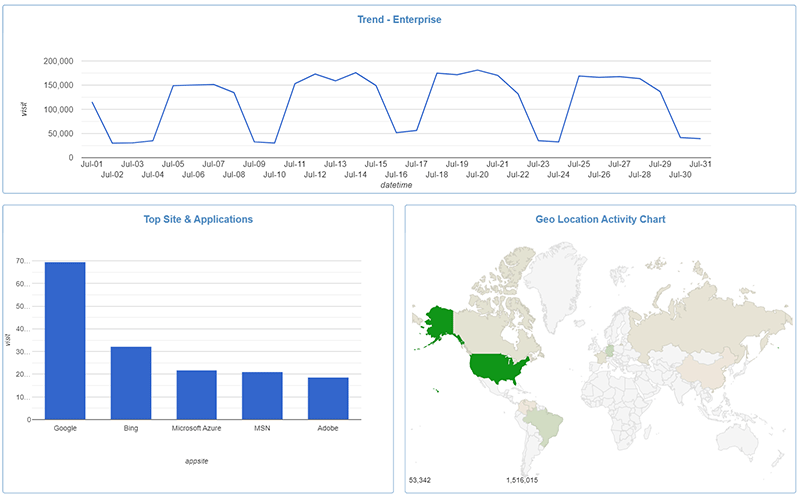
Visualizer Complete Insight into Internet and Cloud Service Activity
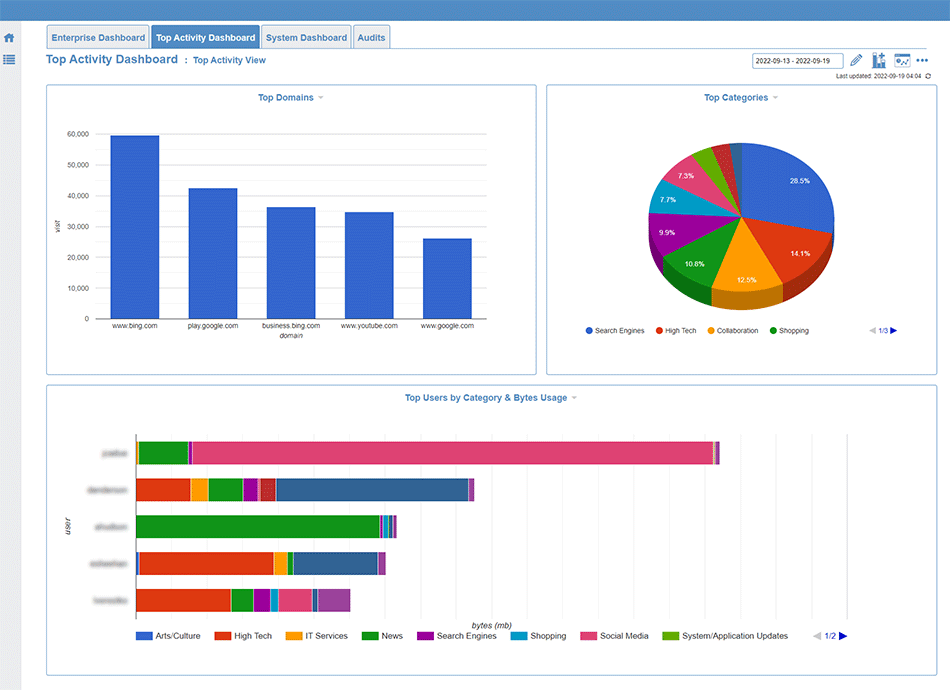
Dashboard
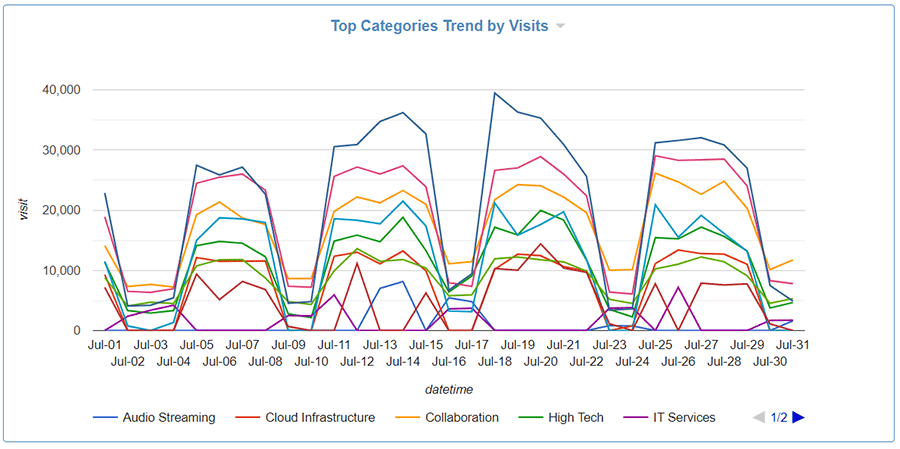
Top Categories Trend by Visits
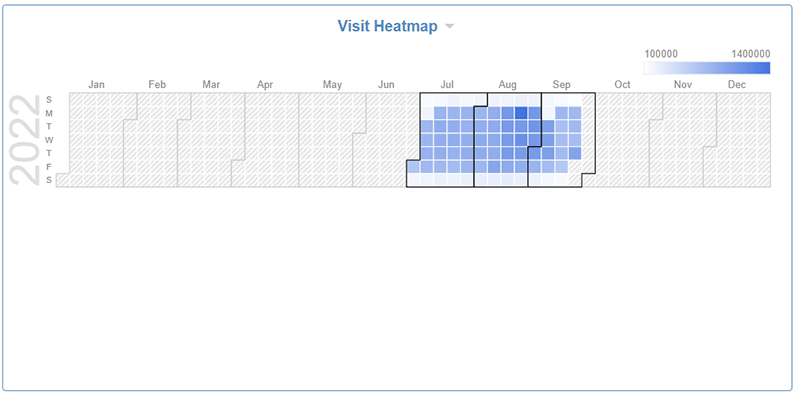
Heatmap - Web Visits by Hour
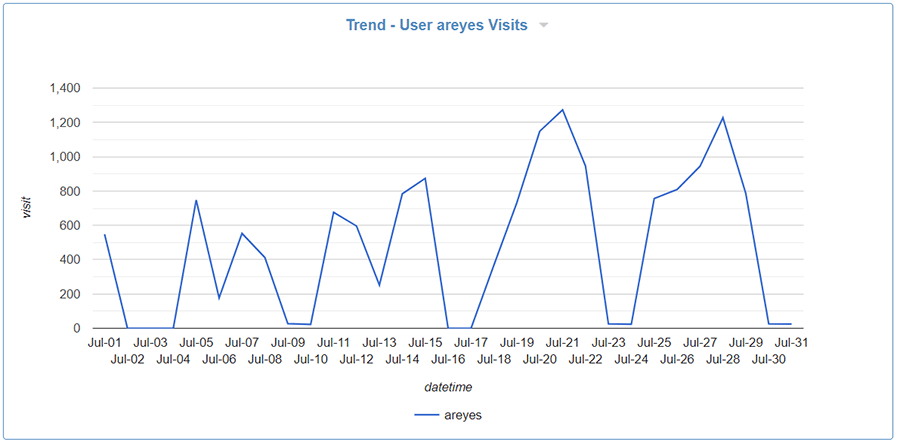
Trend - User Visit Activity
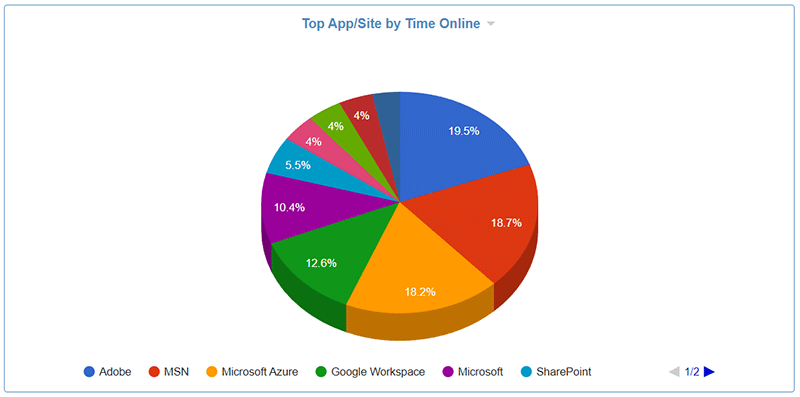
Pie Chart - Top App/Site by Time
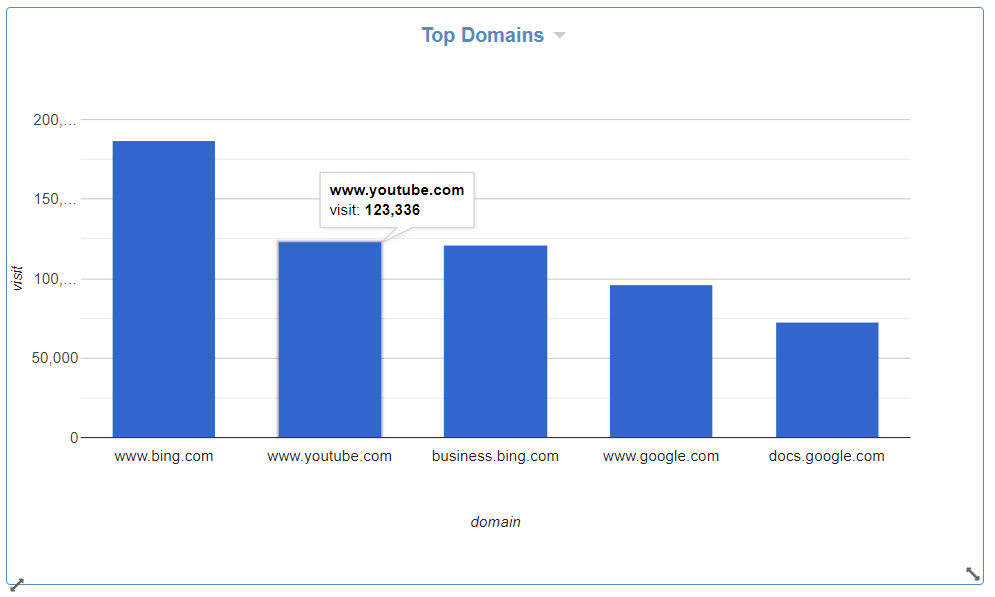
Top Chart - Domains by Visits
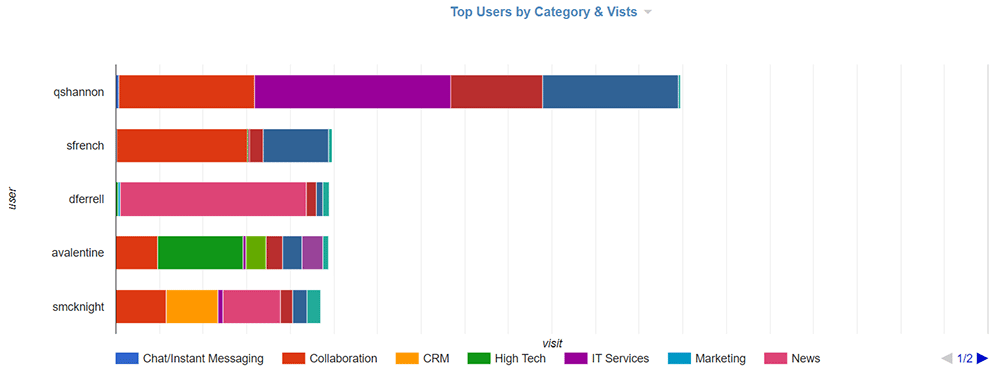
Top Chart - User by Category Visits
Top Table - App/Site
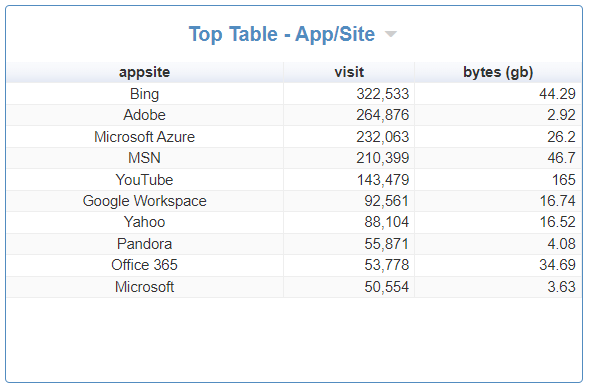
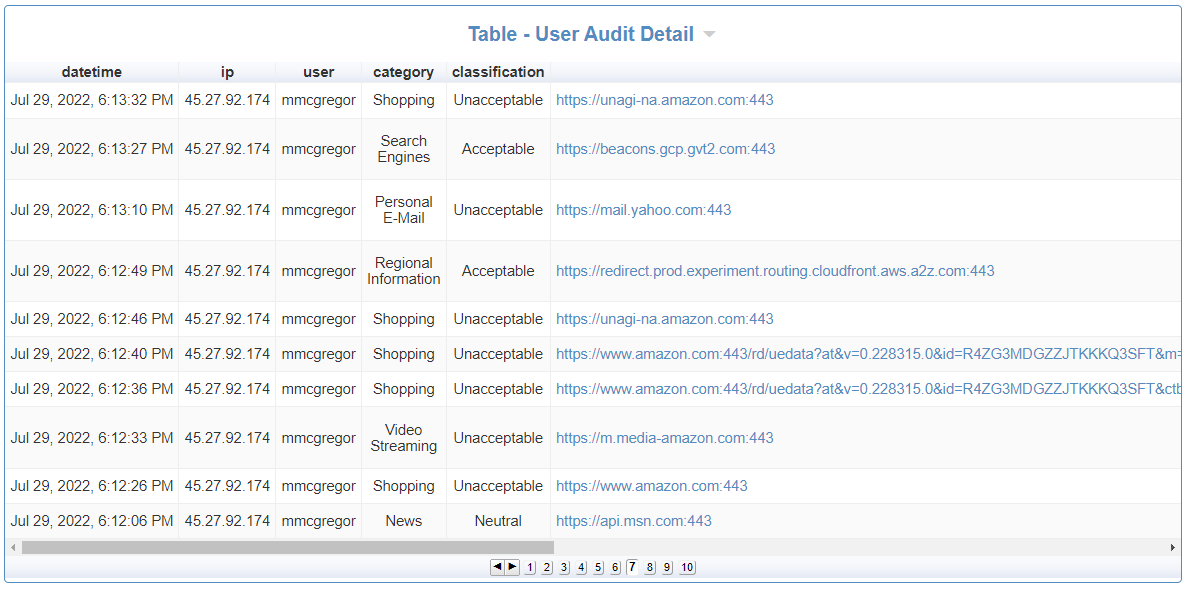
Table - User Audit Detail
Manager Access and Collaboration
- Managers have access only to their own data authorized by IT.
- Each manager can customize panels and dashboards to suit their needs.
- Provides the ability to print dashboards and/or individual report panels.
- Managers have the ability to share the information with stakeholders and collaborate on results.

Manager Access and Collaboration
Visualizer Dashboard Video
Thank you! We will be in touch within one business day.
Once your request is processed, a product specialist will contact you to better understand your goals and schedule a custom product demo.
Why Us
- Industry Leader Since 1996 – Stability, Experience, and Knowledge.
- Global Customer Base – Customers on every continent except Antarctica.
- The Right Focus – Concentrating on The Human Factor.
- Best-of-Breed Products – Visibility, Compliance, Security, and Productivity.
- Exceptional Support – Dedicated, Effective, and Responsive Support.
- Best Value in Key Areas – Functionality, Price, Support, and Customer Service.